Are you someone who cares
Are you someone who cares about the impact you make on the people around you? 💞
Do you have what it takes to drive operational excellence? 💪🏻📈
Do you want to work with me while making the world a better place? 🌱
This is an outstanding role with Raise N’GO, an amazing organisation!
I’m currently the interim person in the role, and am helping CEO and Founder Tiago Carmona and his lovely band of big-hearted do-good people magnify their impact. 💓
The team is just amazing because they care deeply, and that they have this: “Automotivation to deliver with quality.” 🥰
That’s because the environment has been carefully nurtured to be a safe and fun place to grow and do work that matters, with people who care.
I’ll be around to coach and support you as you find your feet, because I also care deeply.
We want the right people on the leadership team to help take Raise N’GO to the next level, so you’re going to want to stick around for awhile to make that happen.
What that means is that this isn’t the right role for you if:
🍩you are expecting commercial-level remuneration and package (we service non profits, and we are not in the same league as the GSIs or the bigger partners)
🍩you are looking for a stepping stone or a temporary gig while you wait for a ‘better’ offer
🙅🏻♀️🙅🏻♀️🙅🏻♀️
Obviously we are looking for leaders who have experience in project delivery and managing teams.
For me – they must also be someone who cares deeply about people, helping them become better versions of themselves, all while delivering amazing projects and making a difference in the world.
If that’s you – WE WANT YOU.
#Leadership
#OnThePeiroll
This is not funny. 😐
This is not funny. 😐

🥦 Why am I so greedy
🥦 Why am I so greedy I always ruin whatever diet I am on?
🥦 Why am I such a lazy slob and never stick to a fitness plan?
🥦 Why am I not good enough to <insert desired goal>?
There are times when asking ‘why’ is not a helpful way to move forward, especially when you’re in a blaming state and not a resourceful state.
If you need to ask why as a first step, then answer honestly.
👉🏻 Because I bought those donuts 🍩🍩🍩 and left them on the table within easy reach.🤌🏻
👉🏻 Because I played games all night so I couldn’t wake up to attend my fitness class. 🏋️🏃
👉🏻 Because it may be easier to be in a defeated state than to ask truly difficult questions and face having to do difficult things to move myself forward.
Then I move towards questions that begin with “How can I…”
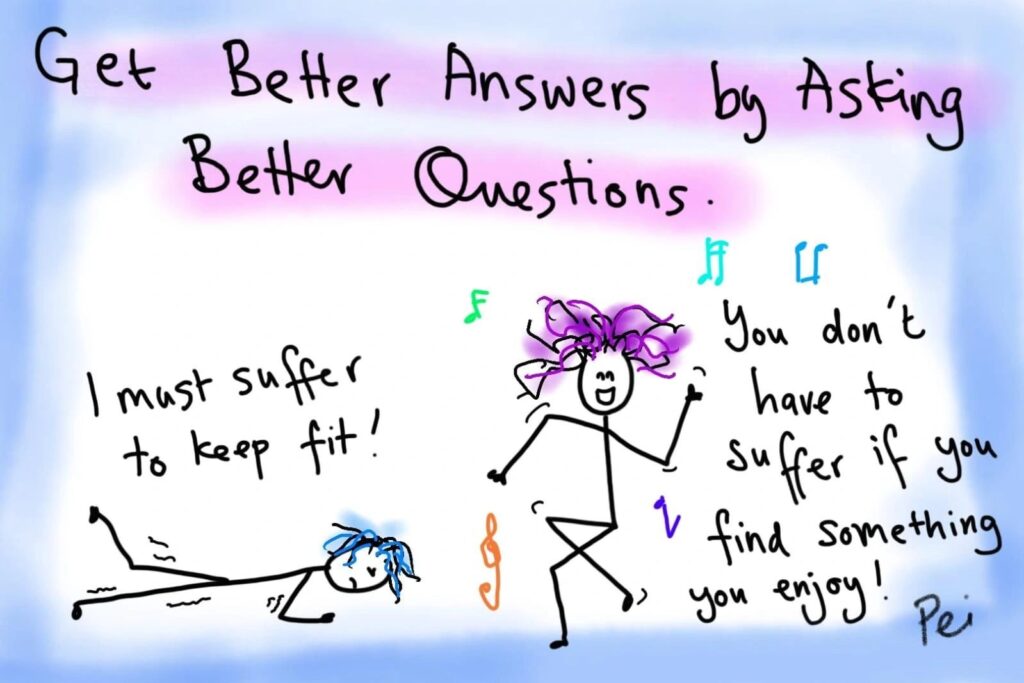
🥕 How can I eat well and not feel deprived?
🥕 How can I keep fit and still have fun?
🥕 How can I learn from this failure and what an I willing to sacrifice for success?
I’m just reflecting on the art of asking good questions, and how people are short changing themselves by falling back on poor questions when things get tough.
Blaming questions like:
😡 Who did this?
😡 Who’s going to pay for this mistake?
😡 Why did we allow this incompetent person to be in charge?
We need to do better and ask more insightful questions.
And we must be prepared to dig deep to find the honest answers, and to peel back layers so that we get to the truth. 🌹
Only then can we move forward.
I find myself asking poor quality questions all the time, but I catch myself and make better questions.
It’s the best way to also change my state as it’s one of the 3 factors of emotional mastery: focus, language and physiology.
What kind of good and poor quality questions do you come across frequently?

Ahhh congratulations
Ahhh congratulations Zair Zahid and Marine Bourgeois has won the two spaces on my next consulting discovery masterclass 😍
I’ll be in touch soon with joining instructions!
Thank you Sindhu Ravi, CSM® and Josh Ortiz for really leaning into this challenge. Sending you both so much luck for the next time! 🍀🍀
In the meantime, hear what others have to say about the Masterclass and enrol now. I only have 2 more spaces left 👉🏻 https://lnkd.in/eGky_K2U
See you there?
#OnThePeiroll
Soft skills are the REAL hard skills. 👌🏻
Soft skills are the REAL hard skills. 👌🏻
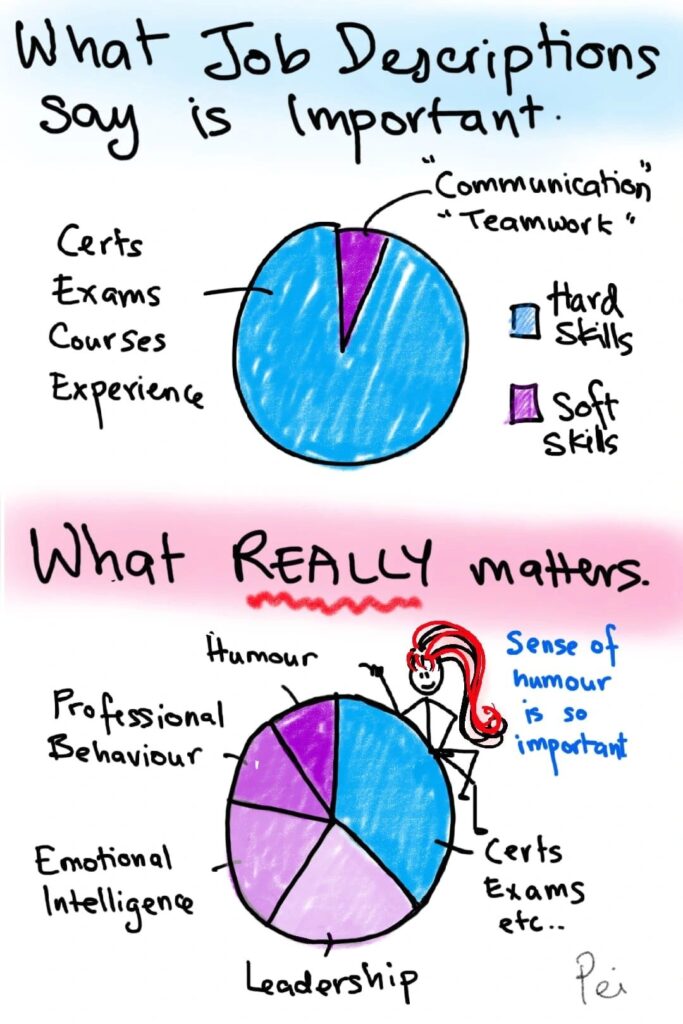
People get jobs because of their ‘hard skills’ – skills, expertise, knowledge, certs, qualifications.
You’d think that that is enough.
Nuh-uh. 🙅🏻♀️
People get “let go” because of their ‘soft skills’… Or lack of. 😳
It’s because the people skills needed for… “people-ing” like working with their team, managing clients and their expectations, communicating clearly, being self-aware and introspective, having a curious and growth mindset… isn’t quite there.
Job descriptions are notorious for playing down these human skills. 😑
Look at the training programmes available, like trailhead and other commercial training – there are far more that teach you how to pass that cert, and how to get that job (interview skills, LinkedIn and CV polishing services) than how to not only keep, but thrive at the job with people you enjoy working with.
I know with so many incredibly smart people, so brainy, so techie, so… clever!
But who are just so awful to work with!
💩 Arrogant – love to show how smart they are by making people feel dumb and small.
💩 Selfish – hoard info because sharing it threatens their status.
💩 Lack of self awareness and not open to sincere feedback – believe they are right and everyone else is wrong.
There are also those who don’t keep their word and don’t communicate, making project work incredibly difficult.
Those who approach life and people with a posture of curiosity, empathy, kindness and an open mind… along with some badass hard skills are those I absolutely want on my team. 😍
And of course, having a sense of humour and playfulness makes life so much more fun! 🥰
Recruiters and hiring managers, make sure your job description isn’t just filled with lists of boring ‘hard’ skills, you should also write it in a way that attracts people who are good at the human side of things too.
What other skills do job roles NOT highlight but are important?

Woohoo! 😍 The results of the #PeiItForwardChallenge are IN
Woohoo! 😍 The results of the #PeiItForwardChallenge are IN, and the 4 finalists to win two free spaces on my next Consulting Discovery masterclass are:
🍩 Josh Ortiz – who smashed the trails and got 10,800 points! Amazing! 🙌🏻
🍩 Sindhu Ravi, CSM® – squeeking ahead with 12,400 points! Awesome! 🥳
🍩 Zair Zahid – pulling ahead by acquiring 32,175 points and helping newcomers in the ohana with guidance over the weekend (sneaking in a small bit of #PeiItForwardChallenge but I like it! 💪🏻)
And drumroll please 🥁🥁🥁
🍩Marine Bourgeois – totally devastating the trails with a whopping 62,225 points!! 😍
Special mention to Tash JesuLoba for supporting Hestia Charity – a refuge for women and children survivors of domestic violence in the Ealing branch. As a survivor of DV, this touched me deeply – so even though you did not get time to do the trails, Tash, I am holding one space for you 💖
Thank you Amy Morris, Nikkhil Mordia who have submitted your final points – amazing work! Sending you both lots of 🍀🍀🍀 for the next time!
Thank you Rakesh Baravathaya, Tena Stromgren, Joal Rose Lin 吴黎菱, Sarah Slye, CSM for participating! Hope next time you’ll get a chance to try again and complete the trails!
In the meantime, dear readers – who gets your vote for one of the two spaces up for grabs?
Just so you know, nominees – it isn’t cheating if you tell your friends and family to create a LinkedIn account just so they can vote for you 😁
Good luck!
